FastAPI performance optimization

- Connection Pool Size
- FastAPI performance optimisation
- Response class
- Keepalive support
- FastAPI optimization
- Middleware
- Nginx in front of FastAPI
- Per-Worker Connection Pool
- Pool Sizing Calculator
- Retry and Circuit Breaker
- Server Runners Comparison
- Sync / Async API Endpoints
- Thread Pool Sizing
- Workers and threads
- Gunicorn Workers and Threads
Gunicorn Workers and Threads
Not strictly FastAPI performance tuning, but performance improvement on runner environment naturally helps for the system. Gunicorn is one straightforward option to run FastAPI in production environment For high performance low latency, cheap, robust and reliable services it is important to get the maximum out of a single computing unit. In this example we will focus on a container with only 2 CPU cores allocated. This is typically used and GitHub Action container has two CPU cores allocated where these measurements were executed.
TL;DR On a 2-core container run 2 workers (threads contribute nothing). Going 1 → 2 workers adds ~+50% on small responses and ~+90% on 1MB responses. A 3rd worker adds ~0-1%; 4-5 workers start losing throughput to context switching.
Verdict
No clear winner, but suggestion of Gunicorn documentation was right, there is such a thing as too many workers.
For a 2-core system:
- 2 workers is the sweet spot for both sync and async endpoints. The 3rd worker adds nothing measurable (~0-1%); the 4th and 5th degrade (~-5% sync, small for async)
- Threads have minimal impact — adding 1-5 threads changes throughput by a few percent at most, confirming the GIL story: don’t judge, measure
- 1MB responses are a different beast: 2 workers nearly double throughput (+87-94%), but 3+ workers actively hurt. A single worker spends ~10s per 1MB request serialized, so it’s the worst case
It is highly recommended making a measurement like this and select the best combination for the given usecase. Feel free to reuse the test code
Why did the numbers change? An earlier revision of this page reported e.g. 446 rps for a single worker on 1MB requests — physically impossible here (a 1MB request takes ~10s at w1, i.e. ~9.7 rps). Those numbers were produced by the old, unreliable harness that silently mixed non-2xx responses and timeouts into the averages. The harness now fails tests on unexpected non-2xx rates and everything was re-measured in a fully green run. The tables below are the trustworthy numbers.
Gunicorn
Gunicorn is a mature, fully featured server and process manager. Gunicorn can manage the processes and threads for us and run UvicornWorker which can carry FastAPI application
Uvicorn
Uvicorn can run FastAPI application even with multiple workers, convenient during development thanks to the reload capability but even their documentation suggests to run with Gunicorn in production
Workers
Workers are pre-forked processes spawn by Gunicorn. Number of workers had to be pre-defined, there is no process pool like e.g: php-fpm
Gunicorn documentation suggests using (2 x $num_cores) + 1 as the number of workers, but also reminds: Always remember, there is such a thing as too many workers. After a point your worker processes will start thrashing system resources decreasing the throughput of the entire system.
We will see it in our measurements
Threads
Gunicorn can also fork processes for each worker. We know the story around GIL, but don’t judge, measure This is how it looks like in action:
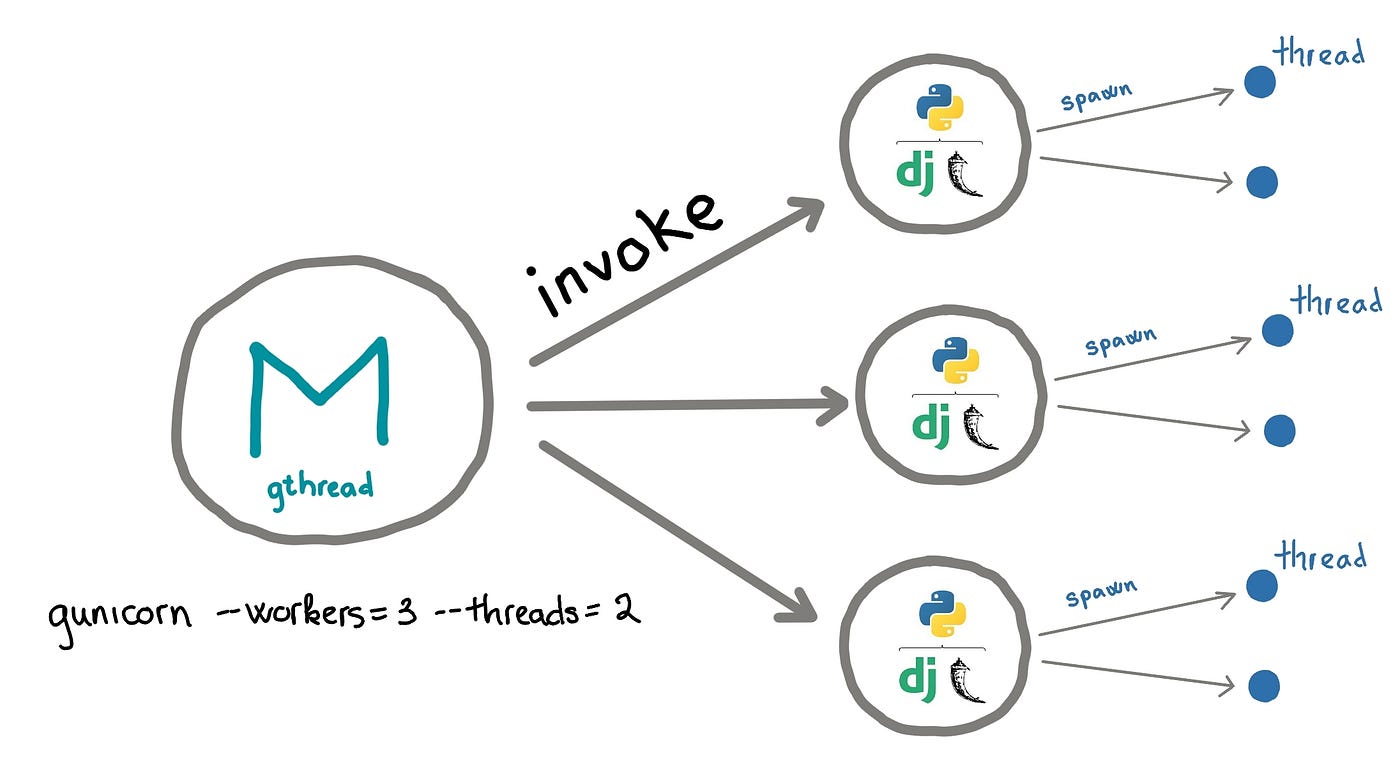
Source: https://medium.com/@nhudinhtuan/gunicorn-worker-types-practice-advice-for-better-performance-7a299bb8f929
Measurements
CI run 36235373898 — Python 3.14, Ubuntu latest. All jobs green, no non-2xx responses.
1-5 Workers and 1-5 threads were measured, this together is 25 measurements in the usual way. There would be place for further measurements E.g measuring with 0 threads or raising the counts to even higher and so on. Request is the same in all cases, the difference is the size of the response (few bytes vs 1MB).
In each table the baseline is 1 worker with the same thread count, and cells are the 3-run average RPS with the % difference to that baseline. Cells marked * contain at least one anomalous single run (1 of the 3 runs was 5-20x below the other two — a straggler in the shared-runtime CI test, not a config effect); treat those cells as inconclusive.
Synchronous API endpoint with small request / response
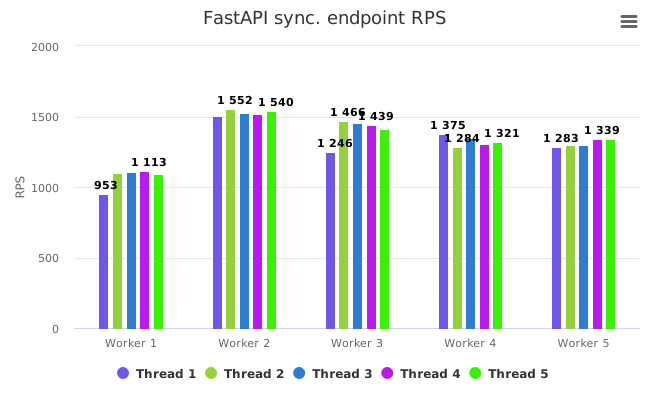
CI Results (run 36235373898, Python 3.14, Ubuntu latest)
| Workers \ Threads | 1 | 2 | 3 | 4 | 5 |
|---|---|---|---|---|---|
| 1 | 1491.71 (baseline) | 1497.47 (baseline) | 1505.88 (baseline) | 1501.49 (baseline) | 1476.71 (baseline) |
| 2 | 2233.90 (+49.75%) | 2271.52 (+51.69%) | 2251.24 (+49.50%) | 2269.25 (+51.13%) | 2246.26 (+52.11%) |
| 3 | 2229.75 (+49.48%) | 2232.98 (+49.12%) | 2247.92 (+49.28%) | 2224.00 (+48.12%) | 2239.11 (+51.63%) |
| 4 | 2142.38 (+43.62%) | 2127.54 (+42.08%) | 1465.30* (-2.69%) | 2139.44 (+42.49%) | 2139.30 (+44.87%) |
| 5 | 2041.04 (+36.83%) | 2084.26 (+39.18%) | 2066.80 (+37.25%) | 2090.11 (+39.20%) | 2066.09 (+39.91%) |
Observation
2 workers delivers the whole win (+50%); the 3rd worker is flat; the 4th and 5th workers start losing throughput to context switching. Thread count changes nothing.
Asynchronous API endpoint with small request / response
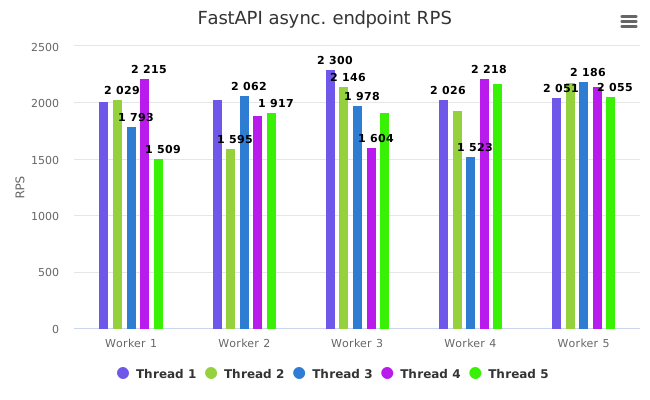
CI Results (run 36235373898, Python 3.14, Ubuntu latest)
| Workers \ Threads | 1 | 2 | 3 | 4 | 5 |
|---|---|---|---|---|---|
| 1 | 1858.25 (baseline) | 1691.09* (baseline) | 1854.43 (baseline) | 1863.96 (baseline) | 1878.77 (baseline) |
| 2 | 1946.01* (+4.72%) | 2011.66* (+18.96%) | 2863.13 (+54.39%) | 2848.64 (+52.83%) | 2144.62* (+14.15%) |
| 3 | 2832.78 (+52.44%) | 2849.43 (+68.50%) | 1923.66* (+3.73%) | 2837.20 (+52.21%) | 2272.50* (+20.96%) |
| 4 | 2692.56 (+44.90%) | 2677.88 (+58.35%) | 2692.66 (+45.20%) | 2223.86* (+19.31%) | 2703.98 (+43.92%) |
| 5 | 2571.95 (+38.41%) | 2649.24 (+56.66%) | 1840.55* (-0.75%) | 2657.17 (+42.56%) | 1839.58* (-2.09%) |
Observation
Async endpoints benefit more from workers than sync ones — 2 workers already reach ~2,840-2,860 rps (the sustained ceiling), 6 of the 8 w2/w3 cells that are *-free cluster at +52-68%. The * cells that show only +5-21% (or negative) are an artifact of a single bad run dragging the average, not a config effect.
Synchronous API endpoint with 1MB response
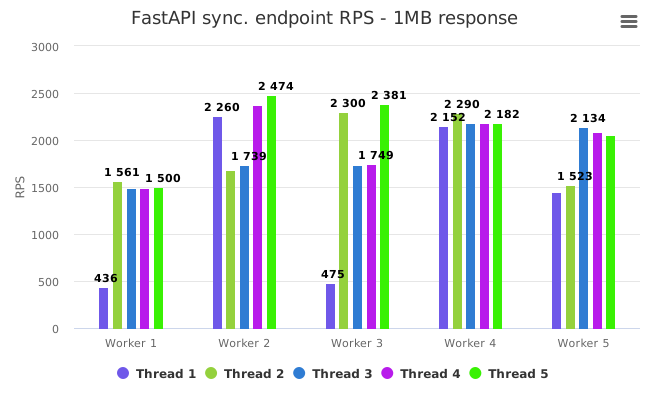
CI Results (run 36235373898, Python 3.14, Ubuntu latest)
| Workers \ Threads | 1 | 2 | 3 | 4 | 5 |
|---|---|---|---|---|---|
| 1 | 9.72 (baseline) | 9.77 (baseline) | 9.67 (baseline) | 9.68 (baseline) | 9.67 (baseline) |
| 2 | 18.48 (+90.02%) | 18.36 (+88.02%) | 18.18 (+87.94%) | 18.28 (+88.84%) | 18.01 (+86.25%) |
| 3 | 14.06 (+44.57%) | 13.71 (+40.37%) | 13.98 (+44.52%) | 13.87 (+43.32%) | 13.75 (+42.23%) |
| 4 | 11.10 (+14.12%) | 11.18 (+14.44%) | 11.38 (+17.64%) | 11.42 (+17.98%) | 11.29 (+16.79%) |
| 5 | 9.37 (-3.60%) | 11.12 (+13.82%) | 11.22 (+16.02%) | 11.22 (+15.94%) | 11.11 (+14.86%) |
Observation
A single worker takes ~10.3s per 1MB request — it is the pipeline. Two workers nearly double throughput (+88-90%). Beyond that, more workers actively hurt: 3 workers +42-45%, 4 workers +14-18%, 5 workers ~+14% (or negative with w1t0). The extra processes thrash the 2-core runtime while competing for memory bandwidth on the big buffers.
Asynchronous API endpoint with 1MB response
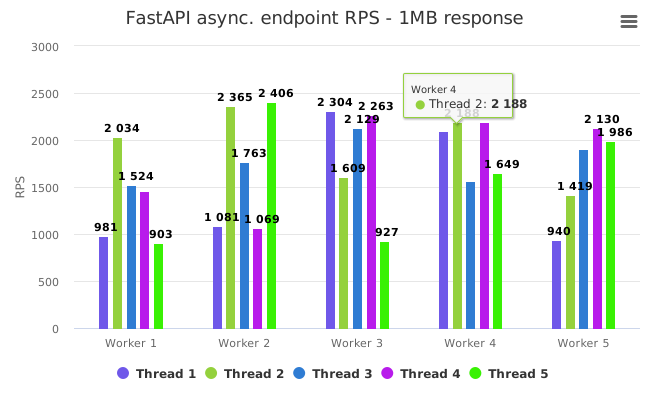
CI Results (run 36235373898, Python 3.14, Ubuntu latest)
| Workers \ Threads | 1 | 2 | 3 | 4 | 5 |
|---|---|---|---|---|---|
| 1 | 9.65 (baseline) | 9.68 (baseline) | 9.51 (baseline) | 9.61 (baseline) | 9.74 (baseline) |
| 2 | 18.26 (+89.29%) | 18.12 (+87.09%) | 18.34 (+92.78%) | 18.60 (+93.65%) | 18.24 (+87.24%) |
| 3 | 13.79 (+42.98%) | 13.87 (+43.27%) | 13.69 (+43.90%) | 13.63 (+41.85%) | 13.79 (+41.58%) |
| 4 | 11.36 (+17.73%) | 11.36 (+17.28%) | 11.40 (+19.80%) | 11.30 (+17.63%) | 11.29 (+15.95%) |
| 5 | 9.47 (-1.87%) | 11.14 (+15.08%) | 11.36 (+19.38%) | 11.48 (+19.53%) | 11.23 (+15.30%) |
Observation
Identical pattern to sync: 2 workers is the clear optimum (+87-94%), more workers degrade monotonically. Async vs sync makes almost no difference at this payload size — the bytes, not the endpoint type, are the bottleneck.