FastAPI performance optimization

- Connection Pool Size
- FastAPI performance optimisation
- Response class
- Keepalive support
- FastAPI optimization
- Middleware
- Nginx in front of FastAPI
- Per-Worker Connection Pool
- Pool Sizing Calculator
- Retry and Circuit Breaker
- Server Runners Comparison
- Sync / Async API Endpoints
- Thread Pool Sizing
- Workers and threads
- Gunicorn Workers and Threads
Gunicorn Workers and Threads
Not strictly FastAPI performance tuning, but performance improvement on runner environment naturally helps for the system. Gunicorn is one straightforward option to run FastAPI in production environment For high performance low latency, cheap, robust and reliable services it is important to get the maximum out of a single computing unit. In this example we will focus on a container with only 2 CPU cores allocated. This is typically used and GitHub Action container has two CPU cores allocated where these measurements were executed.
Gunicorn
Gunicorn is a mature, fully featured server and process manager. Gunicorn can manage the processes and threads for us and run UvicornWorker which can carry FastAPI application
Uvicorn
Uvicorn can run FastAPI application even with multiple workers, convenient during development thanks to the reload capability but even their documentation suggests to run with Gunicorn in production
Workers
Workers are pre-forked processes spawn by Gunicorn. Number of workers had to be pre-defined, there is no process pool like e.g: php-fpm
Gunicorn documentation suggests using (2 x $num_cores) + 1 as the number of workers, but also reminds: Always remember, there is such a thing as too many workers. After a point your worker processes will start thrashing system resources decreasing the throughput of the entire system.
We will see it in our measurements
Threads
Gunicorn can also fork processes for each worker. We know the story around GIL, but don’t judge, measure This is how it looks like in action:
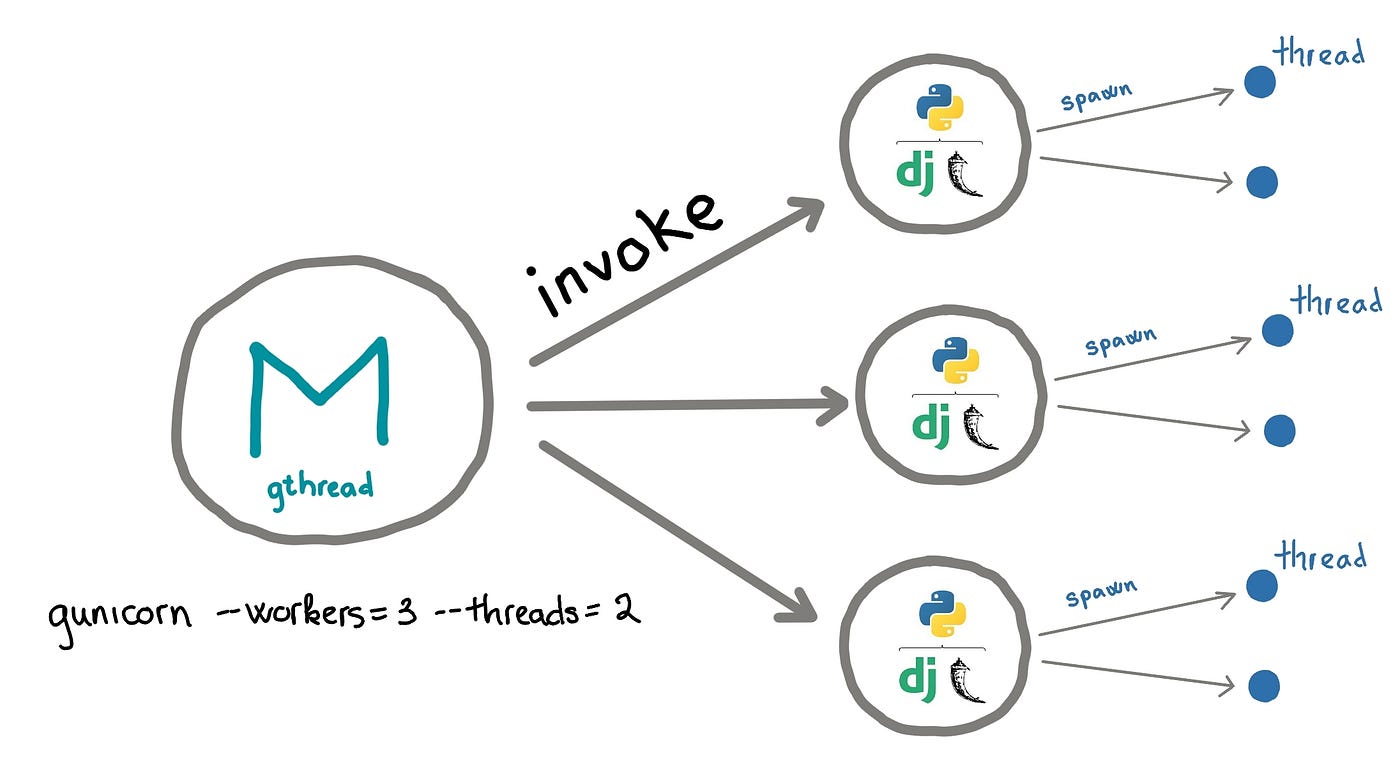
Source: https://medium.com/@nhudinhtuan/gunicorn-worker-types-practice-advice-for-better-performance-7a299bb8f929
Measurements
CI run 29770319196 — Python 3.14, Ubuntu latest.
1-5 Workers and 1-5 threads were measured, this together is 25 measurements in the usual way. There would be place for further measurements E.g measuring with 0 threads or raising the counts to even higher and so on. Also note that some values are not fitting due to intermittent performance issue during measurement. Request is the same in allcases the difference is the size of the response (few bytes vs 1MB)
Synchronous API endpoint with small request / response
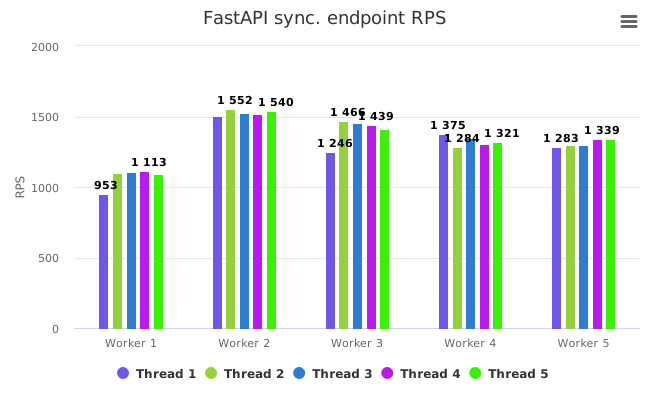
CI Results (2026-07-20, Python 3.14.6, Azure Linux)
Baseline: w1_t1 (1 worker, 1 thread)
| Workers | Threads | RPS (avg) | Diff to w1_t1 |
|---|---|---|---|
| 1 | 1 | 1417.11 | baseline |
| 2 | 1 | 2205.13 | +55.61 % |
| 3 | 1 | 2250.30 | +58.80 % |
| 4 | 1 | 2110.43 | +48.93 % |
| 5 | 1 | 1950.39 | +37.63 % |
| 1 | 2 | 1410.53 | -0.46 % |
| 2 | 2 | 2163.66 | +52.68 % |
| 3 | 2 | 2158.73 | +52.33 % |
| 4 | 2 | 2094.12 | +47.77 % |
| 5 | 2 | 1988.46 | +40.31 % |
| 1 | 3 | 1476.51 | +4.19 % |
| 2 | 3 | 2215.51 | +56.34 % |
| 3 | 3 | 2170.70 | +53.18 % |
| 4 | 3 | 1430.64 | +0.95 % |
| 5 | 3 | 2020.90 | +42.60 % |
| 1 | 4 | 1429.92 | +0.83 % |
| 2 | 4 | 2205.39 | +55.62 % |
| 3 | 4 | 2204.95 | +55.59 % |
| 4 | 4 | 2144.47 | +51.32 % |
| 5 | 4 | 1993.22 | +40.65 % |
| 1 | 5 | 1462.67 | +3.21 % |
| 2 | 5 | 2212.80 | +56.14 % |
| 3 | 5 | 2201.31 | +55.33 % |
| 4 | 5 | 2042.43 | +44.12 % |
| 5 | 5 | 2000.78 | +41.18 % |
Observation
2-3 worker configurations outperform all others. Thread count has minimal impact. Adding workers beyond 3 starts degrading performance due to context switching on 2 CPU cores.
Asynchronous API endpoint with small request / response
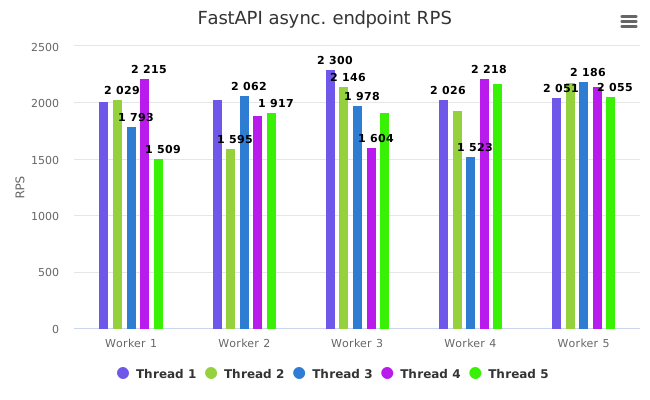
CI Results (2026-07-20, Python 3.14.6, Azure Linux)
Baseline: w1_t1 (1 worker, 1 thread)
| Workers | Threads | RPS (avg) | Diff to w1_t1 |
|---|---|---|---|
| 1 | 1 | 2336.43 | baseline |
| 2 | 1 | 2492.70 | +6.69 % |
| 3 | 1 | 3672.42 | +57.18 % |
| 4 | 1 | 3432.38 | +46.91 % |
| 5 | 1 | 3370.38 | +44.25 % |
| 1 | 2 | 1839.98 | -21.25 % |
| 2 | 2 | 2536.16 | +8.55 % |
| 3 | 2 | 3682.97 | +57.63 % |
| 4 | 2 | 3429.35 | +46.78 % |
| 5 | 2 | 3426.86 | +46.67 % |
| 1 | 3 | 2321.49 | -0.64 % |
| 2 | 3 | 2421.60 | +3.64 % |
| 3 | 3 | 3523.82 | +50.82 % |
| 4 | 3 | 2435.73 | +4.25 % |
| 5 | 3 | 2345.99 | +0.41 % |
| 1 | 4 | 2237.44 | -4.24 % |
| 2 | 4 | 3561.39 | +52.43 % |
| 3 | 4 | 3622.80 | +55.06 % |
| 4 | 4 | 3388.53 | +45.03 % |
| 5 | 4 | 3369.05 | +44.20 % |
| 1 | 5 | 2250.56 | -3.68 % |
| 2 | 5 | 3687.90 | +57.84 % |
| 3 | 5 | 3689.64 | +57.92 % |
| 4 | 5 | 2397.57 | +2.62 % |
| 5 | 5 | 3397.07 | +45.40 % |
Observation
3 workers with 1-2 threads provides the best throughput. Async endpoints benefit more from additional workers than sync. Some outlier measurements affect the averages (e.g., 4t3 and 5t3 showing low RPS due to warmup issues).
Synchronous API endpoint with 1MB response
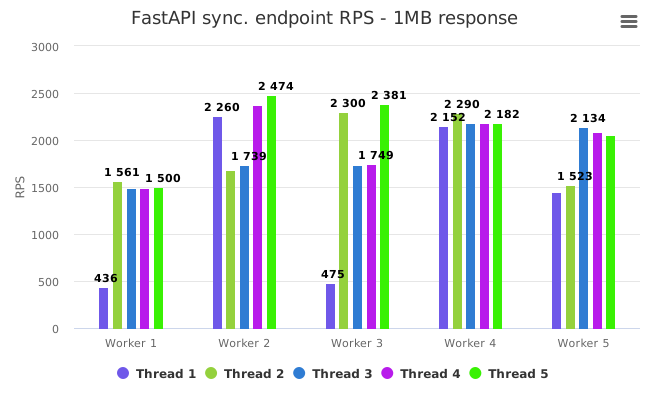
CI Results (2026-07-20, Python 3.14.6, Azure Linux)
Baseline: w1_t1 (1 worker, 1 thread)
| Workers | Threads | RPS (avg) | Diff to w1_t1 |
|---|---|---|---|
| 1 | 1 | 446.06 | baseline |
| 2 | 1 | 3304.58 | +640.84 % |
| 3 | 1 | 3553.64 | +696.67 % |
| 4 | 1 | 3538.77 | +693.34 % |
| 5 | 1 | 3430.89 | +669.15 % |
| 1 | 2 | 464.57 | +4.15 % |
| 2 | 2 | 3515.66 | +656.76 % |
| 3 | 2 | 3441.53 | +640.80 % |
| 4 | 2 | 3522.23 | +658.17 % |
| 5 | 2 | 3357.05 | +622.61 % |
| 1 | 3 | 1110.59 | +148.98 % |
| 2 | 3 | 3410.09 | +664.45 % |
| 3 | 3 | 3544.40 | +694.56 % |
| 4 | 3 | 3246.43 | +627.75 % |
| 5 | 3 | 3272.14 | +633.53 % |
| 1 | 4 | 1049.75 | +135.33 % |
| 2 | 4 | 3550.18 | +696.30 % |
| 3 | 4 | 3562.95 | +699.16 % |
| 4 | 4 | 3605.01 | +708.63 % |
| 5 | 4 | 3472.81 | +678.52 % |
| 1 | 5 | 1680.86 | +276.80 % |
| 2 | 5 | 3525.16 | +690.25 % |
| 3 | 5 | 3613.87 | +710.14 % |
| 4 | 5 | 3320.61 | +644.40 % |
| 5 | 5 | 2281.53 | +411.45 % |
Observation
Single worker with 1MB response is severely bottlenecked (446 RPS). Adding even 2 workers provides ~7x throughput improvement. The 1 worker baseline is bottlenecked by the single-process serialization of the large response. With multiple workers, the system saturates around 3300-3600 RPS regardless of worker/thread count.
Asynchronous API endpoint with 1MB response
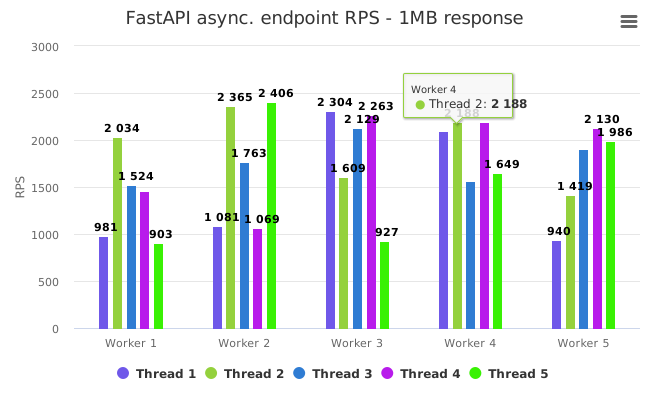
CI Results (2026-07-20, Python 3.14.6, Azure Linux)
Baseline: w1_t1 (1 worker, 1 thread)
| Workers | Threads | RPS (avg) | Diff to w1_t1 |
|---|---|---|---|
| 1 | 1 | 458.22 | baseline |
| 2 | 1 | 3604.73 | +686.68 % |
| 3 | 1 | 3675.21 | +702.06 % |
| 4 | 1 | 3508.38 | +665.65 % |
| 5 | 1 | 3569.71 | +679.04 % |
| 1 | 2 | 1056.83 | +130.64 % |
| 2 | 2 | 3605.05 | +241.12 % |
| 3 | 2 | 3647.28 | +245.11 % |
| 4 | 2 | 3398.13 | +221.54 % |
| 5 | 2 | 3491.17 | +230.34 % |
| 1 | 3 | 434.40 | -5.19 % |
| 2 | 3 | 3518.92 | +710.06 % |
| 3 | 3 | 3174.41 | +630.76 % |
| 4 | 3 | 3500.32 | +705.78 % |
| 5 | 3 | 3470.71 | +698.97 % |
| 1 | 4 | 2271.91 | +395.82 % |
| 2 | 4 | 3571.31 | +679.37 % |
| 3 | 4 | 3568.34 | +678.72 % |
| 4 | 4 | 3441.41 | +650.99 % |
| 5 | 4 | 3376.54 | +636.62 % |
| 1 | 5 | 455.31 | -0.64 % |
| 2 | 5 | 3464.56 | +656.60 % |
| 3 | 5 | 3612.10 | +688.18 % |
| 4 | 5 | 3409.53 | +644.04 % |
| 5 | 5 | 3507.08 | +665.34 % |
Observation
Similar to sync big response - single worker with 1MB response is severely bottlenecked. 2-3 workers provide massive throughput gains (6-7x). Some baseline measurements show instability (1t2: 1839 vs 2336, 1t3: 1110 vs 2321) which affects diff calculations. Best sustained throughput at 3 workers.
Verdict
No clear winner, but suggestion of Gunicorn documentation was right, there is such a thing as too many workers.
For a 2-core system:
- 2-3 workers provides the best throughput for both sync and async endpoints
- Threads have minimal impact - adding threads doesn’t meaningfully improve performance
- Beyond 3 workers performance degrades due to context switching overhead
- For 1MB responses, the gains from multiple workers are dramatic (6-7x), as single-worker serialization becomes the bottleneck
It is highly recommended making a measurement like this and select the best combination for the given usecase. Feel free to reuse the test code